Comparison of WST SST in situ using WCT cloud mask
getting sst and cloud information
from s3mdbreader.slstrreader import read_satellite_data
import datetime
import numpy

# extraction criteria

matchup_root = '/mount/common-storage/data/mdb/slstr_osisaf_mdb_test/'
start = datetime.datetime(2016, 11, 20)
end = datetime.datetime(2016, 11, 30)

# match-ups fields to read and use later
slstr_fields = ['S3A_SL_2_WST__sea_surface_temperature', 'S3A_SL_2_WST__quality_level', 'S3A_SL_2_WCT__cloud_in',
                'S3A_SL_2_WST__time', 'S3A_SL_2_WST__lat', 'S3A_SL_2_WST__lon', 'S3A_SL_2_WST__origin']

other_fields = ['lat', 'lon']
allfields = slstr_fields + other_fields

source = 'cmems_drifter'

# perform the data selection
res = read_satellite_data(source, start, matchup_root, allfields, end_day=end)

valid_wst_matchups = ~res['S3A_SL_2_WST__time'].mask
for _ in res.keys():
    res[_] = res[_][valid_wst_matchups]
slstr_sst = res['S3A_SL_2_WST__sea_surface_temperature']

nbmatchups = slstr_sst.size
nbvalidsst = slstr_sst.count()
print "Number of match-ups : ", nbmatchups
print "Number of valid SST : ", nbvalidsst
Number of match-ups :  19139
Number of valid SST :  14041
Read the cloud mask calculated from flag combination in S3A_SL_2_WCT__cloud_in
from s3mdbreader.slstrreader import read_cloud_mask

cloudy = read_cloud_mask(source, start, matchup_root, end_day=end)[valid_wst_matchups]

nbcloudy = numpy.count_nonzero(cloudy)
print "Number of cloudy pixels : %d (%d percent)" % (nbcloudy, nbcloudy * 100 / nbmatchups)
print "Number of clear sky pixels : %d" % (nbmatchups - nbcloudy)
Number of cloudy pixels : 15485 (80 percent)
Number of clear sky pixels : 3654
Compare with in situ
Read in situ data
from s3mdbreader.slstrreader import read_insitu_data

# Read in situ data
fields = ['cmems_drifter__water_temperature', 'cmems_drifter__solar_zenith_angle',
          'cmems_drifter__quality_level']
res_insitu = read_insitu_data(source, start, matchup_root, fields, end_day=end)
for _ in res_insitu.keys():
    res_insitu[_] = res_insitu[_][valid_wst_matchups]
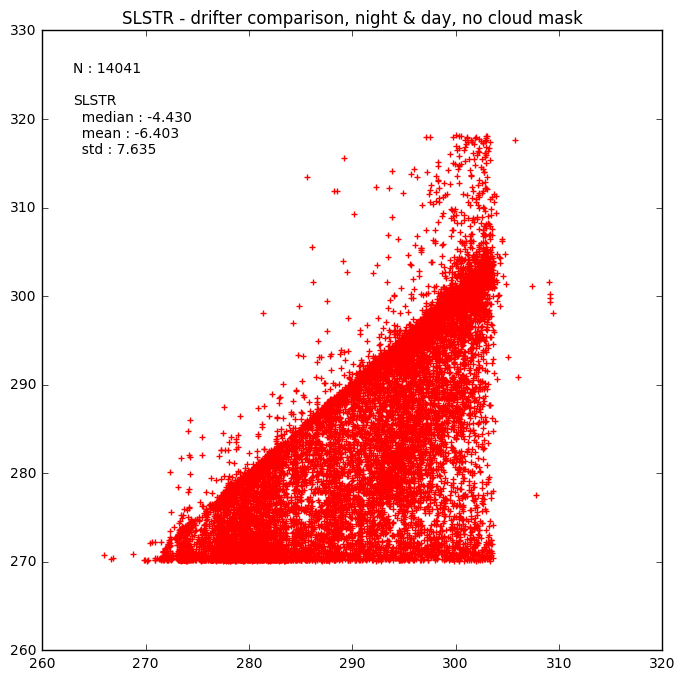
Plot first without any masking
from matplotlib import pyplot

fig = pyplot.figure(figsize=(8,8))

insitu_sst = res_insitu['cmems_drifter__water_temperature'] + 273.15

pyplot.scatter(insitu_sst, slstr_sst, color='r', marker='+')

moments = "N : {}\n\nSLSTR\n  median : {:.03f}\n  mean : {:.03f}\n  std : {:.03f}".format(
    (slstr_sst).count(),
    numpy.ma.median(slstr_sst - insitu_sst),
    (slstr_sst - insitu_sst).mean(),
    (slstr_sst - insitu_sst).std(),
)
pyplot.text(0.05, 0.95,
            moments,
            fontsize=10,
            verticalalignment='top', horizontalalignment='left',
            transform=pyplot.gca().transAxes
           )
pyplot.title("SLSTR - drifter comparison, night & day, no cloud mask")

pyplot.show()
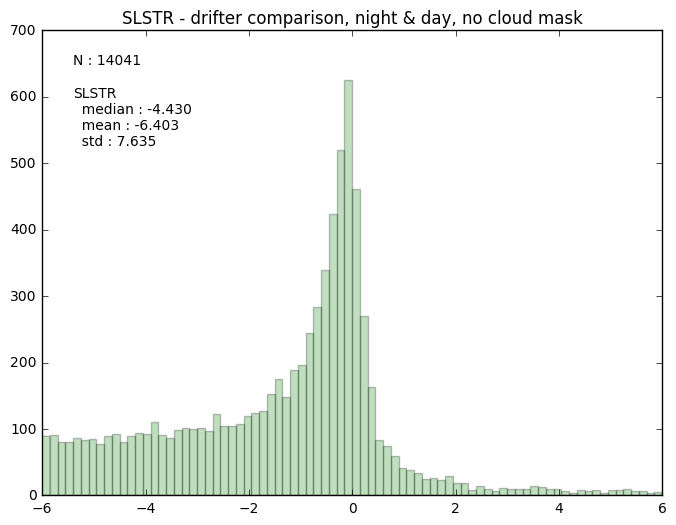
# histogram comparison
fig = pyplot.figure(figsize=(8,6))

diff_slstr = (slstr_sst - insitu_sst)

# plot histogram in minutes
n, bins, patches = pyplot.hist(diff_slstr, bins=80, range=[-6, 6], facecolor='green', alpha=0.25)
moments = "N : {}\n\nSLSTR\n  median : {:.03f}\n  mean : {:.03f}\n  std : {:.03f}".format(
    (slstr_sst).count(),
    numpy.ma.median(slstr_sst - insitu_sst),
    (slstr_sst - insitu_sst).mean(),
    (slstr_sst - insitu_sst).std(),
)
pyplot.text(0.05, 0.95,
            moments,
            fontsize=10,
            verticalalignment='top', horizontalalignment='left',
            transform=pyplot.gca().transAxes
           )
pyplot.title("SLSTR - drifter comparison, night & day, no cloud mask")

pyplot.show()
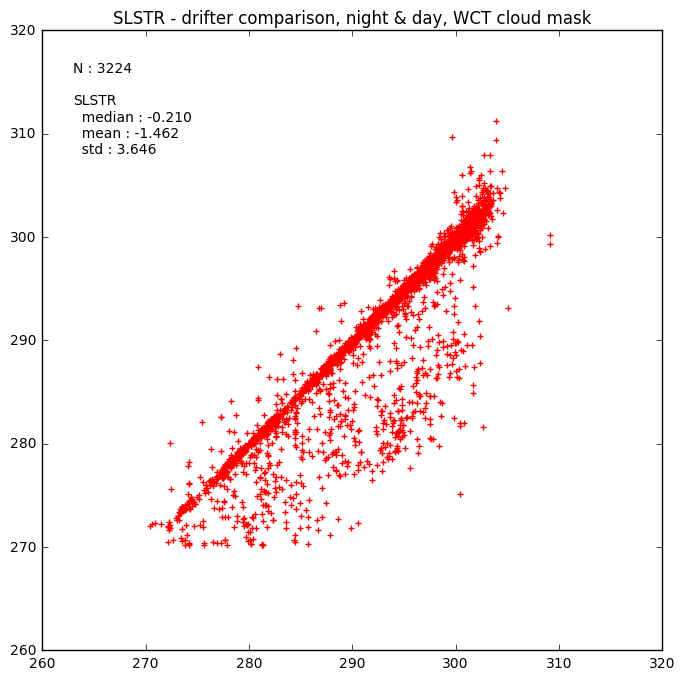
Mask SSTs where cloudy
slstr_sst = numpy.ma.masked_where(cloudy, res['S3A_SL_2_WST__sea_surface_temperature'])
insitu_sst = numpy.ma.masked_where(cloudy, res_insitu['cmems_drifter__water_temperature'] + 273.15)
fig = pyplot.figure(figsize=(8,8))

pyplot.scatter(insitu_sst, slstr_sst, color='r', marker='+')

moments = "N : {}\n\nSLSTR\n  median : {:.03f}\n  mean : {:.03f}\n  std : {:.03f}".format(
    (slstr_sst).count(),
    numpy.ma.median(slstr_sst - insitu_sst),
    (slstr_sst - insitu_sst).mean(),
    (slstr_sst - insitu_sst).std(),
)
pyplot.text(0.05, 0.95,
            moments,
            fontsize=10,
            verticalalignment='top', horizontalalignment='left',
            transform=pyplot.gca().transAxes
           )
pyplot.title("SLSTR - drifter comparison, night & day, WCT cloud mask")

pyplot.show()
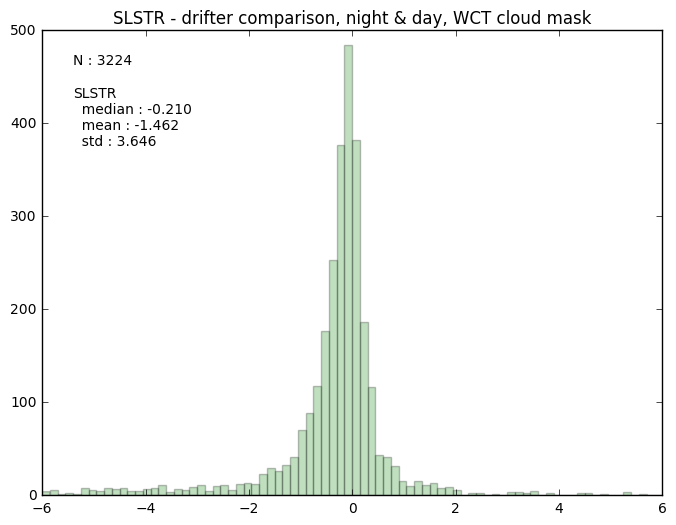
# histogram comparison
fig = pyplot.figure(figsize=(8,6))

diff_slstr = (slstr_sst - insitu_sst)
moments = "N : {}\n\nSLSTR\n  median : {:.03f}\n  mean : {:.03f}\n  std : {:.03f}".format(
    (slstr_sst).count(),
    numpy.ma.median(slstr_sst - insitu_sst),
    (slstr_sst - insitu_sst).mean(),
    (slstr_sst - insitu_sst).std(),
)
# plot histogram in minutes
n, bins, patches = pyplot.hist(diff_slstr, bins=80, range=[-6, 6], facecolor='green', alpha=0.25)
pyplot.text(0.05, 0.95,
            moments,
            fontsize=10,
            verticalalignment='top', horizontalalignment='left',
            transform=pyplot.gca().transAxes
            )
pyplot.title("SLSTR - drifter comparison, night & day, WCT cloud mask")

pyplot.show()
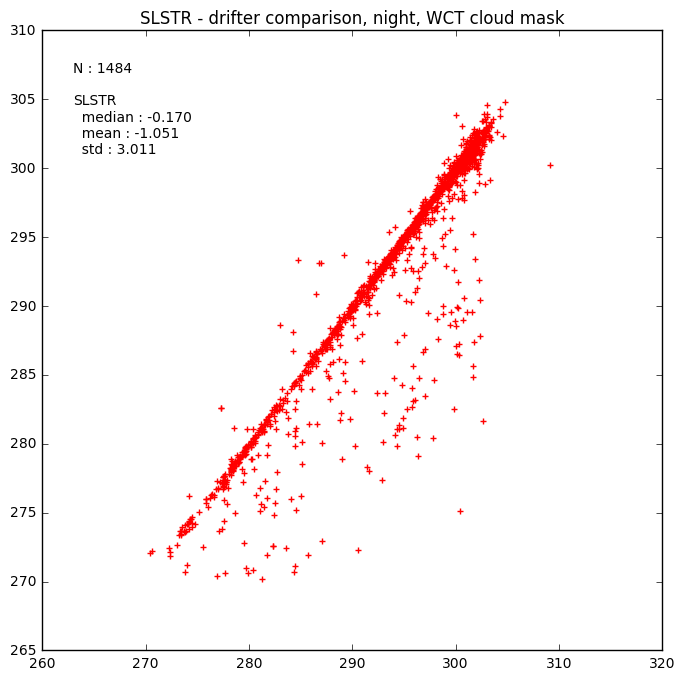
night time statistics
from matplotlib import pyplot
fig = pyplot.figure(figsize=(8,8))
night = res_insitu['cmems_drifter__solar_zenith_angle'] > 90.
# scatterplot comparison
pyplot.scatter(insitu_sst[night], slstr_sst[night], color='r', marker='+')
moments = "N : {}\n\nSLSTR\n median : {:.03f}\n mean : {:.03f}\n std : {:.03f}".format(
(slstr_sst[night]).count(),
numpy.ma.median(slstr_sst[night] - insitu_sst[night]),
(slstr_sst[night] - insitu_sst[night]).mean(),
(slstr_sst[night] - insitu_sst[night]).std(),
)
pyplot.text(0.05, 0.95,
moments,
fontsize=10,
verticalalignment='top', horizontalalignment='left',
transform=pyplot.gca().transAxes
)
pyplot.title("SLSTR - drifter comparison, night, WCT cloud mask")
pyplot.show()
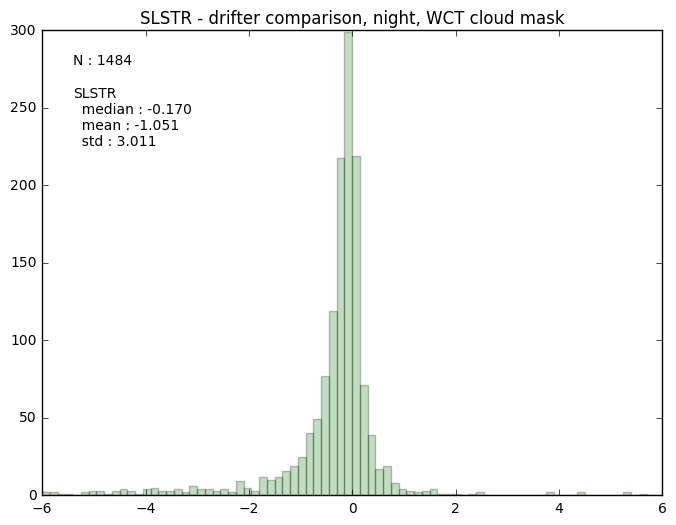
# histogram comparison
fig = pyplot.figure(figsize=(8,6))
diff_slstr = (slstr_sst[night] - insitu_sst[night])
moments = "N : {}\n\nSLSTR\n median : {:.03f}\n mean : {:.03f}\n std : {:.03f}".format(
(slstr_sst[night]).count(),
numpy.ma.median(slstr_sst[night] - insitu_sst[night]),
(slstr_sst[night] - insitu_sst[night]).mean(),
(slstr_sst[night] - insitu_sst[night]).std(),
)
# plot histogram in minutes
n, bins, patches = pyplot.hist(diff_slstr, bins=80, range=[-6, 6], facecolor='green', alpha=0.25)
pyplot.text(0.05, 0.95,
moments,
fontsize=10,
verticalalignment='top', horizontalalignment='left',
transform=pyplot.gca().transAxes
)
pyplot.title("SLSTR - drifter comparison, night, WCT cloud mask")
pyplot.show()
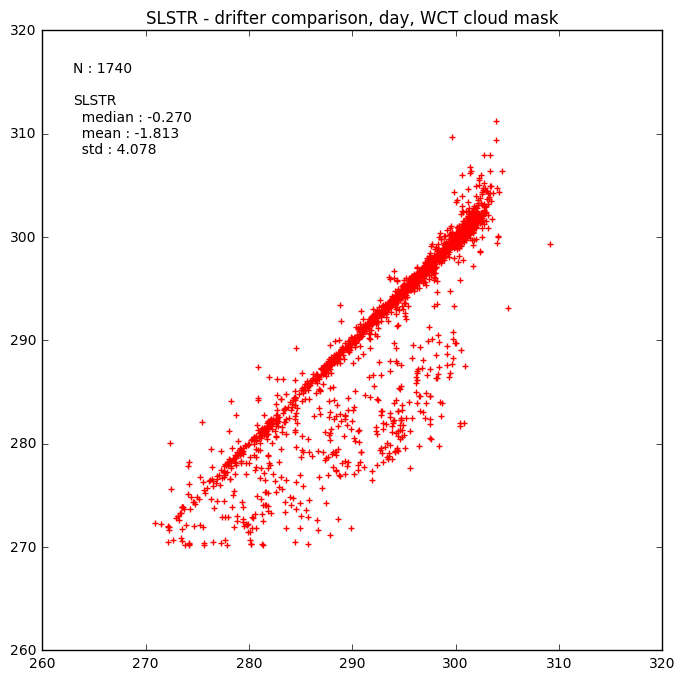
day time statistics
from matplotlib import pyplot
fig = pyplot.figure(figsize=(8,8))
day = res_insitu['cmems_drifter__solar_zenith_angle'] <= 90.
pyplot.scatter(insitu_sst[day], slstr_sst[day], color='r', marker='+')
moments = "N : {}\n\nSLSTR\n median : {:.03f}\n mean : {:.03f}\n std : {:.03f}".format(
(slstr_sst[day]).count(),
numpy.ma.median(slstr_sst[day] - insitu_sst[day]),
(slstr_sst[day] - insitu_sst[day]).mean(),
(slstr_sst[day] - insitu_sst[day]).std(),
)
pyplot.text(0.05, 0.95,
moments,
fontsize=10,
verticalalignment='top', horizontalalignment='left',
transform=pyplot.gca().transAxes
)
pyplot.title("SLSTR - drifter comparison, day, WCT cloud mask")
pyplot.show()
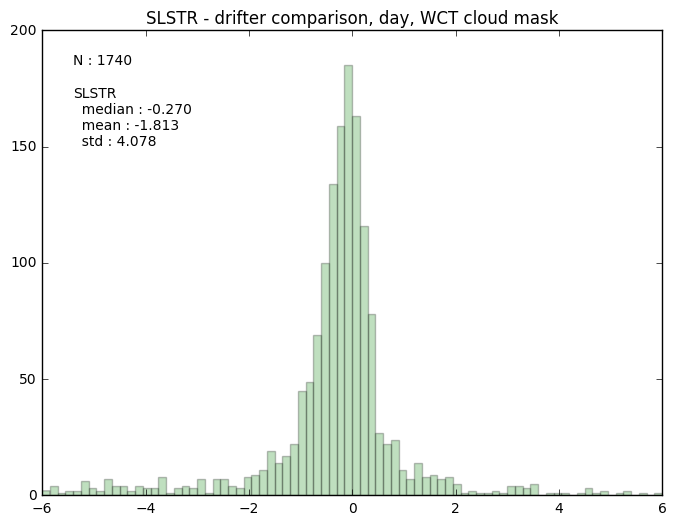
# histogram comparison
fig = pyplot.figure(figsize=(8,6))
diff_slstr = (slstr_sst[day] - insitu_sst[day])
moments = "N : {}\n\nSLSTR\n median : {:.03f}\n mean : {:.03f}\n std : {:.03f}".format(
(slstr_sst[day]).count(),
numpy.ma.median(slstr_sst[day] - insitu_sst[day]),
(slstr_sst[day] - insitu_sst[day]).mean(),
(slstr_sst[day] - insitu_sst[day]).std(),
)
# plot histogram in minutes
n, bins, patches = pyplot.hist(diff_slstr, bins=80, range=[-6, 6], facecolor='green', alpha=0.25)
pyplot.text(0.05, 0.95,
moments,
fontsize=10,
verticalalignment='top', horizontalalignment='left',
transform=pyplot.gca().transAxes
)
pyplot.title("SLSTR - drifter comparison, day, WCT cloud mask")
pyplot.show()
spatial coherence test
boxres = read_satellite_data(source, start, matchup_root,
                             ['S3A_SL_1_RBT_IR__S8_BT_in', 'S3A_SL_1_RBT_IR__S9_BT_in'],
                             end_day=end, box=True, subbox=3)
for _ in boxres.keys():
    boxres[_] = boxres[_][valid_wst_matchups, :, :]
threshold = 0.05
coherent = ~((boxres['S3A_SL_1_RBT_IR__S8_BT_in'][:, :, :].std(axis=(1,2)) > threshold) |
             (boxres['S3A_SL_1_RBT_IR__S9_BT_in'][:, :, :].std(axis=(1,2)) > threshold))
filledbox = (boxres['S3A_SL_1_RBT_IR__S8_BT_in'][: :, :].count(axis=(1,2)) == 9)

coherent = numpy.ma.masked_where(cloudy, coherent)
filledbox = numpy.ma.masked_where(cloudy, filledbox)

daytime = res_insitu['cmems_drifter__solar_zenith_angle'] <= 90.
nighttime = res_insitu['cmems_drifter__solar_zenith_angle'] >= 90.

print "Number of match-ups : ", coherent.count()
print "Number of coherent matchups : ", numpy.count_nonzero(coherent.compressed())
print "Number of filled and coherent matchups : ", numpy.count_nonzero((filledbox & coherent).compressed())
print
print "Nighttime"
print "Number of coherent matchups : ", numpy.count_nonzero((coherent & nighttime).compressed())
print "Number of filled and coherent matchups : ", numpy.count_nonzero((filledbox & coherent & nighttime).compressed())
print
print "Daytime"
print "Number of coherent matchups : ", numpy.count_nonzero(coherent & daytime)
print "Number of filled and coherent matchups : ", numpy.count_nonzero((filledbox & coherent & daytime).compressed())
Number of match-ups :  3417
Number of coherent matchups :  1163
Number of filled and coherent matchups :  1148

Nighttime
Number of coherent matchups :  478
Number of filled and coherent matchups :  471

Daytime
Number of coherent matchups :  942
Number of filled and coherent matchups :  677
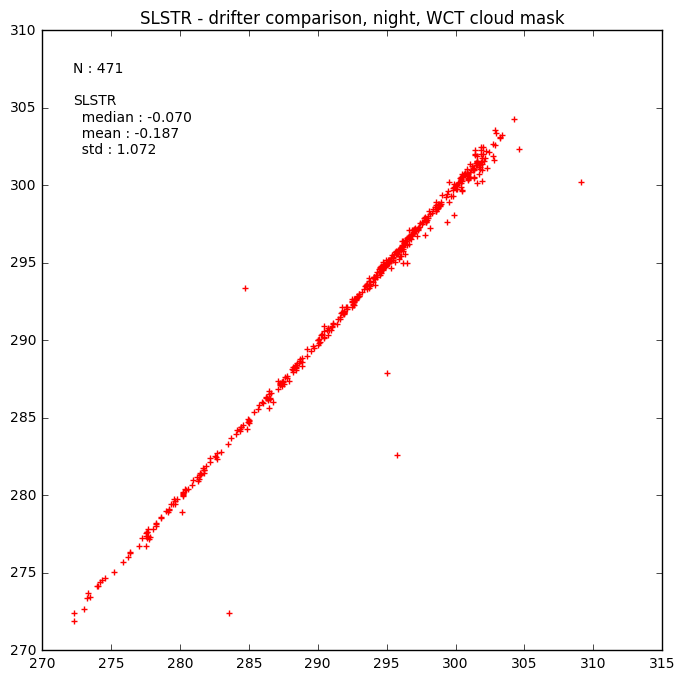
fig = pyplot.figure(figsize=(8,8))
night = (nighttime & coherent & filledbox)
# scatterplot comparison
pyplot.scatter(insitu_sst[night], slstr_sst[night], color='r', marker='+')
moments = "N : {}\n\nSLSTR\n median : {:.03f}\n mean : {:.03f}\n std : {:.03f}".format(
(slstr_sst[night]).count(),
numpy.ma.median(slstr_sst[night] - insitu_sst[night]),
(slstr_sst[night] - insitu_sst[night]).mean(),
(slstr_sst[night] - insitu_sst[night]).std(),
)
pyplot.text(0.05, 0.95,
moments,
fontsize=10,
verticalalignment='top', horizontalalignment='left',
transform=pyplot.gca().transAxes
)
pyplot.title("SLSTR - drifter comparison, night, WCT cloud mask")
pyplot.show()
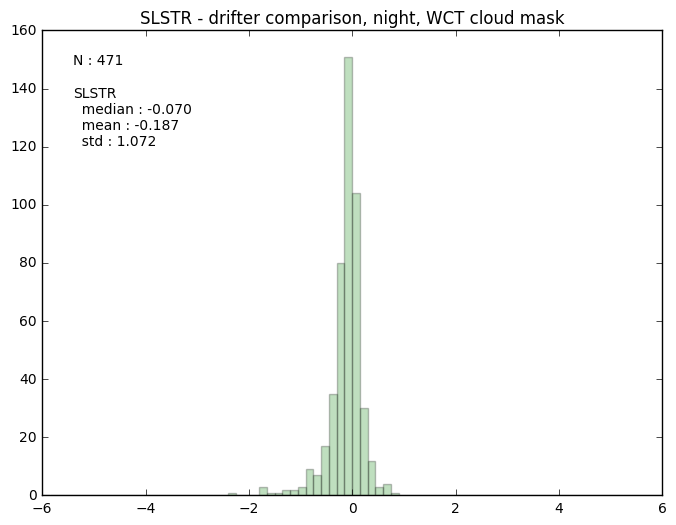
# histogram comparison
fig = pyplot.figure(figsize=(8,6))
diff_slstr = (slstr_sst[night] - insitu_sst[night])
moments = "N : {}\n\nSLSTR\n median : {:.03f}\n mean : {:.03f}\n std : {:.03f}".format(
(slstr_sst[night]).count(),
numpy.ma.median(slstr_sst[night] - insitu_sst[night]),
(slstr_sst[night] - insitu_sst[night]).mean(),
(slstr_sst[night] - insitu_sst[night]).std(),
)
# plot histogram in minutes
n, bins, patches = pyplot.hist(diff_slstr, bins=80, range=[-6, 6], facecolor='green', alpha=0.25)
pyplot.text(0.05, 0.95,
moments,
fontsize=10,
verticalalignment='top', horizontalalignment='left',
transform=pyplot.gca().transAxes
)
pyplot.title("SLSTR - drifter comparison, night, WCT cloud mask")
pyplot.show()